Introduction
Dow Theory is the foundation that all modern technical analysis is built on. This image-rich module explains its core principles — trends, phases, volume, and market structure — and includes a dedicated section on applying Dow Theory to the Indian markets (Nifty, Sensex & Bank Nifty). Free and open to everyone on Kaapra Campus.
1. What Is Dow Theory?
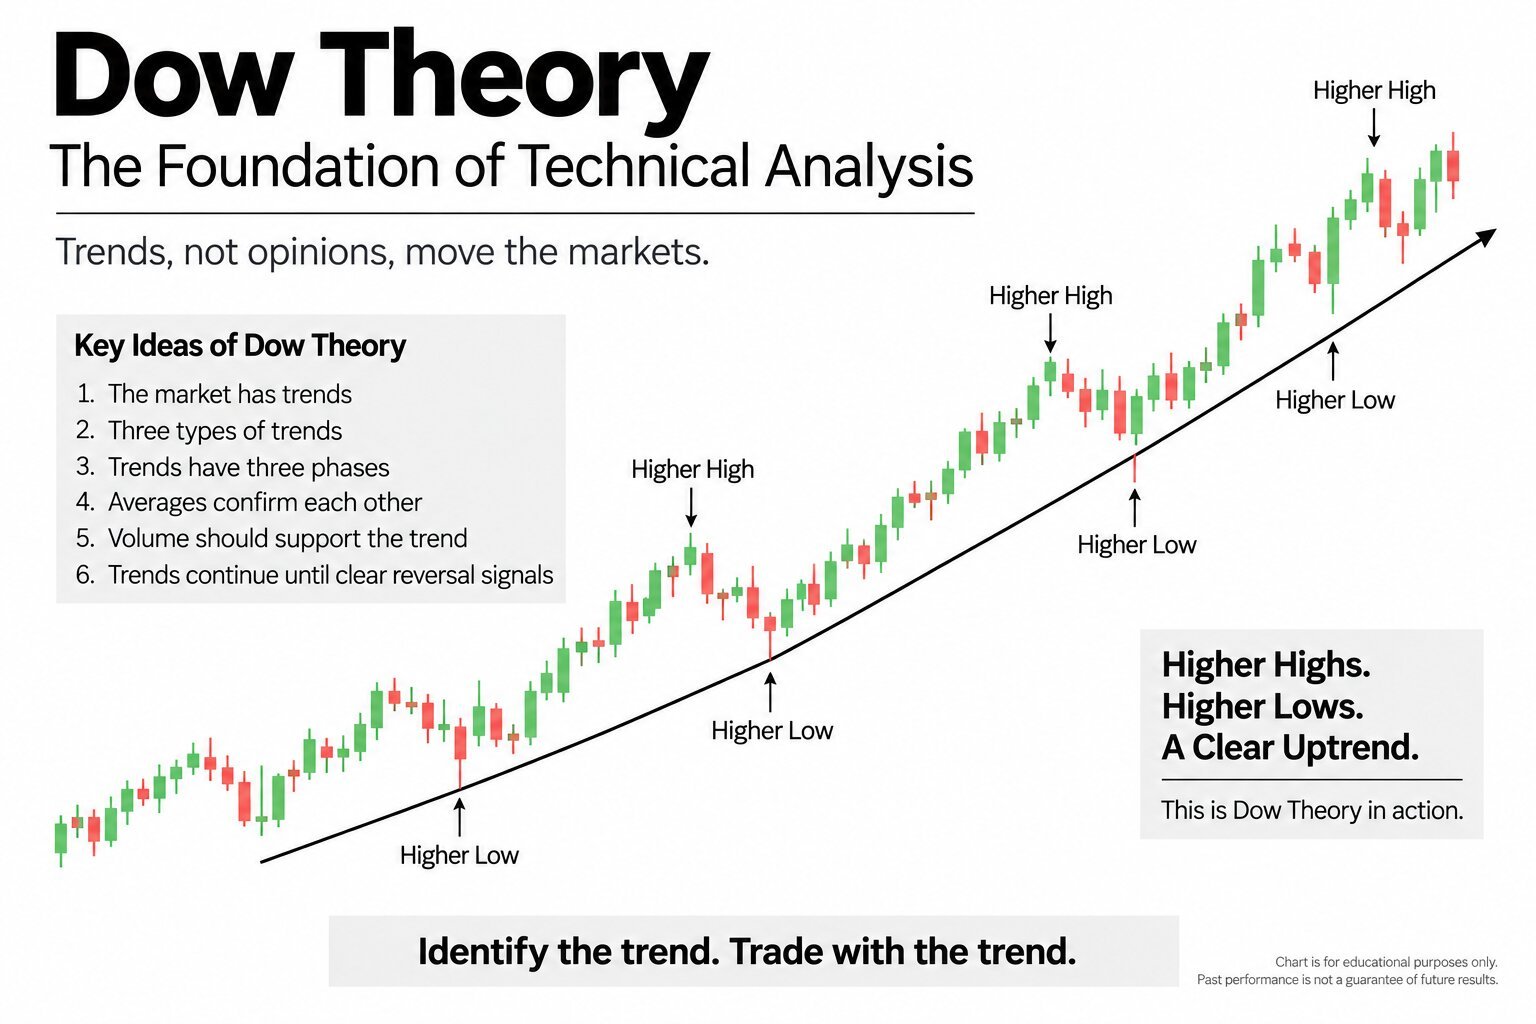
Dow Theory is the original foundation of modern technical analysis, developed from the writings of Charles Dow (co-founder of Dow Jones) over a century ago. Almost every charting concept traders use today — trends, support and resistance, higher highs — traces back to its core ideas.
At its heart, Dow Theory is a framework for understanding how markets move: not randomly, but in identifiable trends made up of repeating structures. Master this, and the rest of technical analysis becomes far easier to understand.
2. The Market Discounts Everything
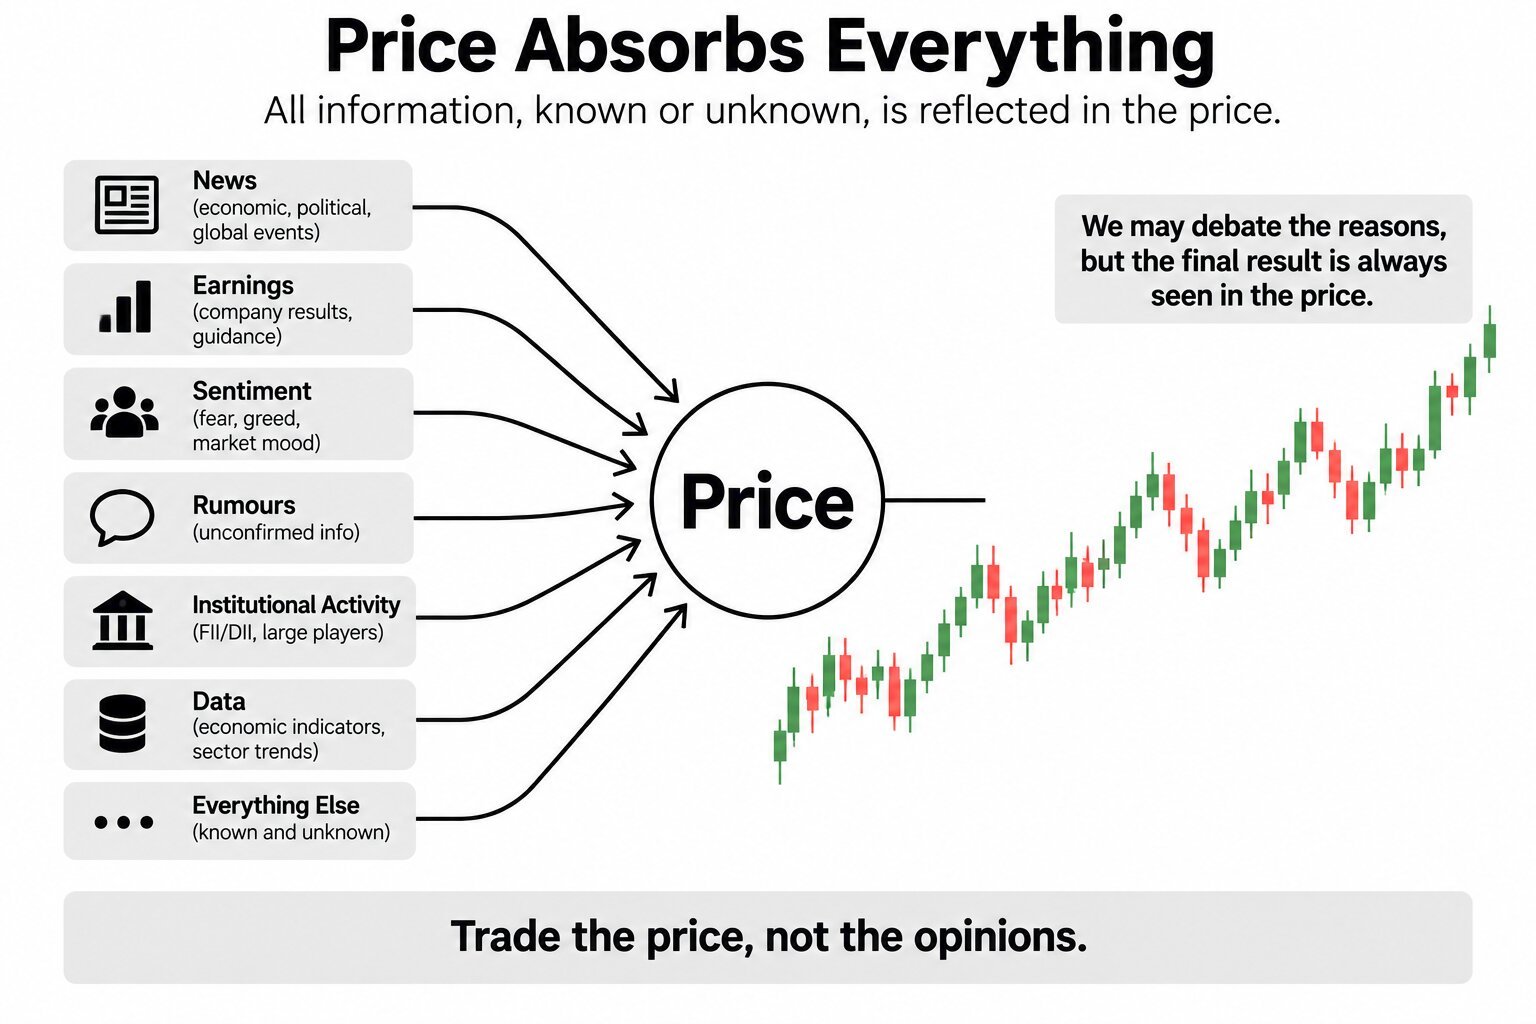
The first tenet: the market price already reflects all known information — news, earnings, sentiment, expectations. Whatever anyone knows about a stock is already 'priced in'.
The practical takeaway for a trader: rather than chasing every news headline, study the price itself, because price is the collective verdict of everyone acting on that information. This is why Dow Theory focuses on charts over predictions.
3. The Three Types of Trends
Dow identified that markets move in three simultaneous trends of different sizes. The Primary trend is the major direction, lasting months to years (the 'tide'). The Secondary trend is a medium correction against it, lasting weeks (the 'wave'). The Minor trend is short-term noise, lasting days (the 'ripple').
Understanding which trend you're trading is critical — a short-term dip within a strong primary uptrend is a very different situation from a genuine reversal.

4. The Three Phases of a Primary Trend
Every major trend moves through three phases. In an uptrend: the Accumulation phase (smart money quietly buys while others are fearful), the Public Participation phase (the trend becomes obvious and the crowd joins — the longest phase), and the Distribution phase (smart money sells to the euphoric crowd near the top).
Recognising which phase the market is in helps a trader avoid the classic mistake: buying heavily in the distribution phase, right when informed money is exiting.

5. Trends Are Confirmed by Volume
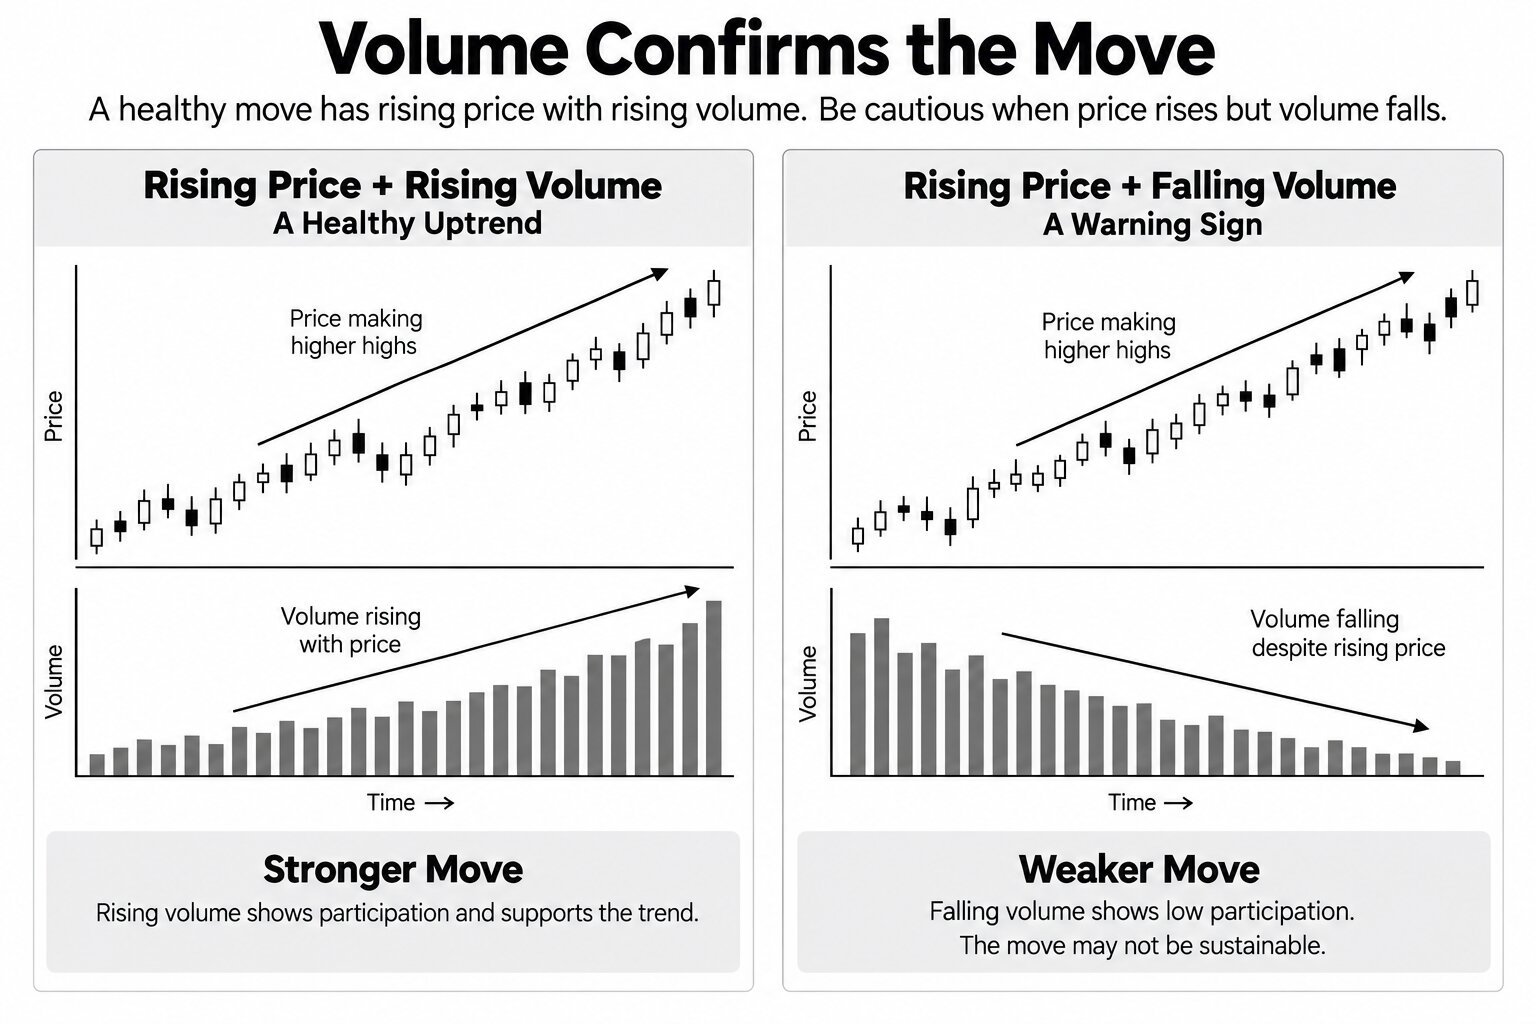
Dow Theory holds that volume should confirm the trend. In a healthy uptrend, volume rises as price rises and falls during pullbacks. If price makes a new high but volume is weak, it's a warning the move may lack conviction.
Volume is the 'fuel' behind a move — this single principle underpins why volume analysis appears throughout technical analysis.
6. Trends Continue Until a Clear Reversal
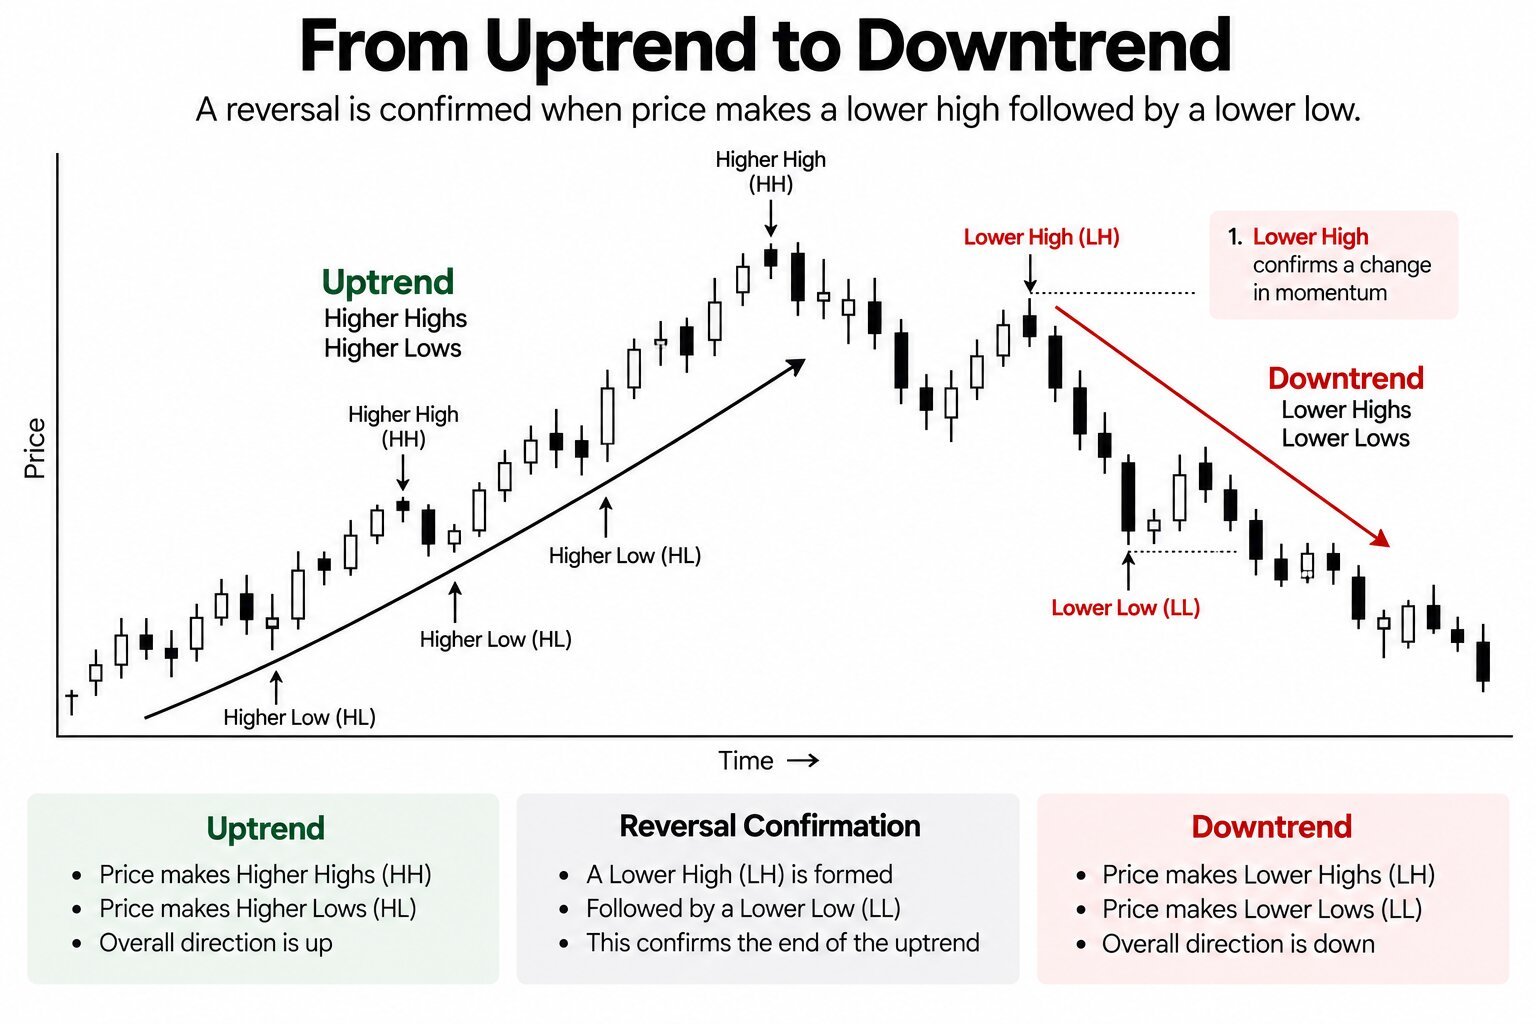
A core Dow principle: a trend is assumed to remain in force until there is clear evidence it has reversed — not merely a pause or a small pullback. This guards traders against exiting a good trend too early on every minor wobble.
The structural signal of a reversal is a break in the pattern of highs and lows — for example, an uptrend making a lower high and a lower low for the first time. Until that happens, the trend gets the benefit of the doubt.
7. Reading Trend Structure — Highs and Lows
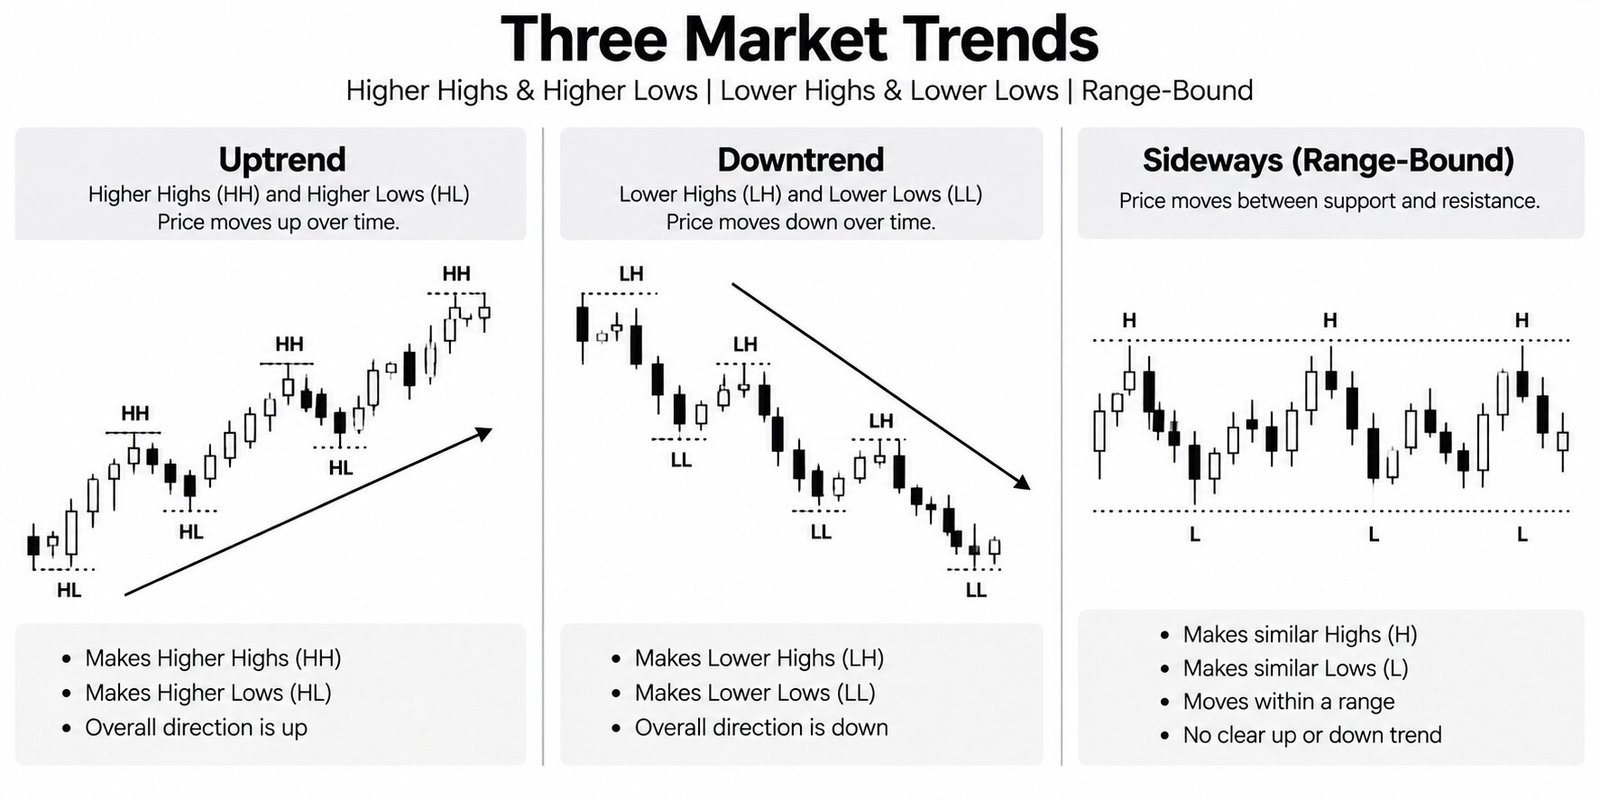
The most practical, everyday use of Dow Theory is reading market structure through swing highs and lows. An uptrend = higher highs and higher lows. A downtrend = lower highs and lower lows. A sideways market = roughly equal highs and lows.
This simple lens — just tracking the sequence of peaks and troughs — is one of the most reliable ways to read any chart, on any timeframe, in any market.
8. Dow Theory in the Indian Markets — Nifty & Sensex
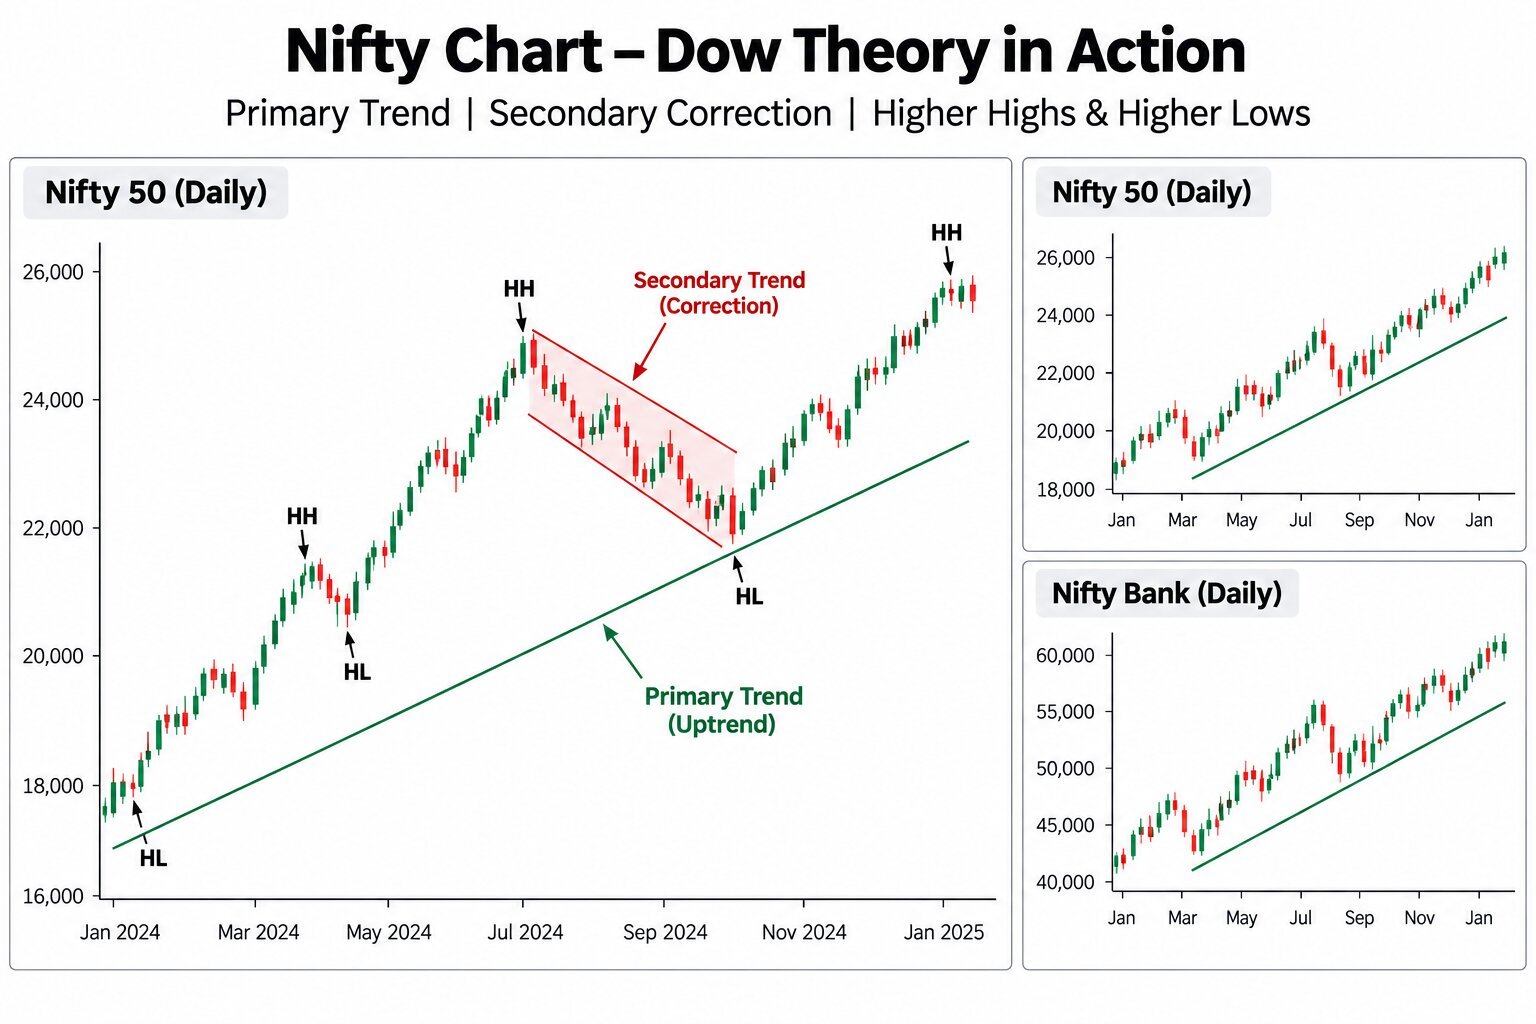
Dow Theory was built on US indices, but its principles apply directly to Indian markets — because they describe crowd behaviour, which is universal. The Nifty 50 and Sensex move in exactly the same primary/secondary/minor trend structure.
A practical Indian application of Dow's 'confirmation' principle: Dow originally compared two indices (industrials and railroads) and looked for them to confirm each other. In India, traders watch whether the Nifty and Bank Nifty confirm each other — when both make new highs together, the trend is considered strong; when they diverge (one making new highs, the other failing), it's an early warning. Reading Nifty's higher-highs/higher-lows structure, respecting volume on big up-days, and identifying accumulation/distribution around major tops and bottoms all work on Indian charts just as Dow described.
9. Applying Dow Theory — Honest Guidance
Dow Theory is a lens for understanding market direction and structure — not a precise buy/sell signal system. Its real value is in keeping you on the right side of the major trend and helping you distinguish a genuine reversal from ordinary noise.
Combine it with the other tools on Kaapra Campus — support/resistance, candlesticks, volume — for a complete picture. And remember: no framework removes risk. Use it to think more clearly, not to predict with false certainty.
This is educational content only, not investment advice.