Introduction
Beyond individual candles, price tends to form recognizable shapes over days and weeks. This module covers the handful of classic patterns worth knowing, and — just as importantly — what actually confirms each one.
1. Head & Shoulders
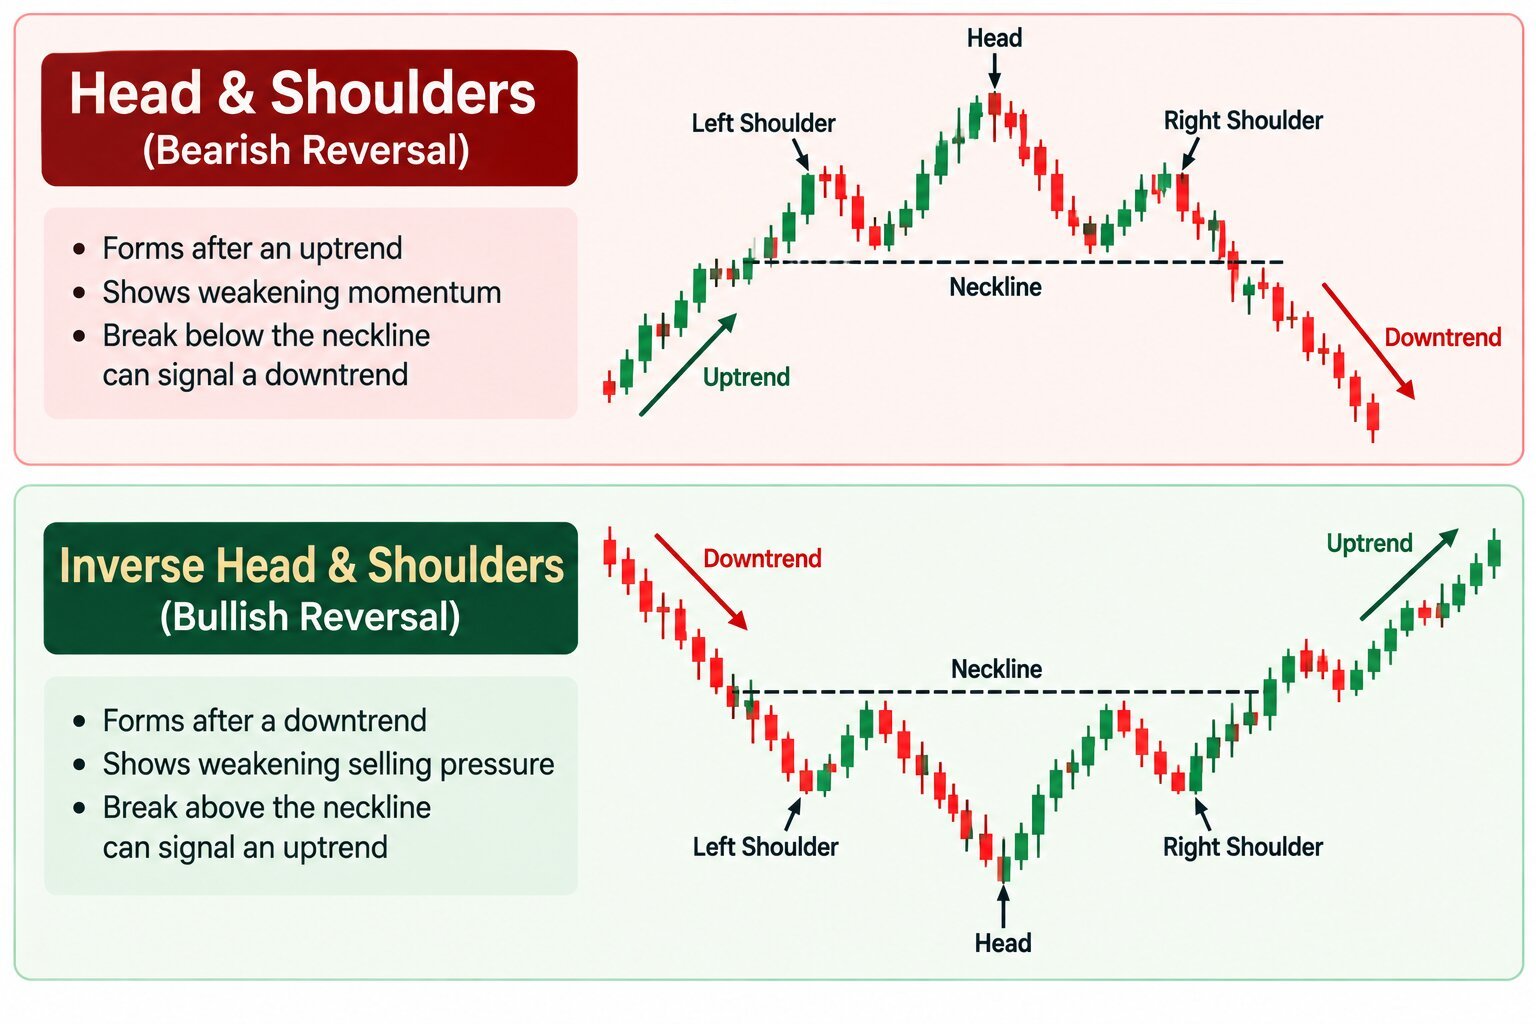
This pattern shows three peaks — a higher middle peak (the 'head') flanked by two lower peaks (the 'shoulders') — and typically signals a trend reversal from up to down. The inverse version (inverse head & shoulders) signals the opposite, a bottom forming.
The 'neckline' connecting the lows between the peaks is the key level — a break below it is what confirms the pattern, not the shape alone.
2. Double Top & Double Bottom
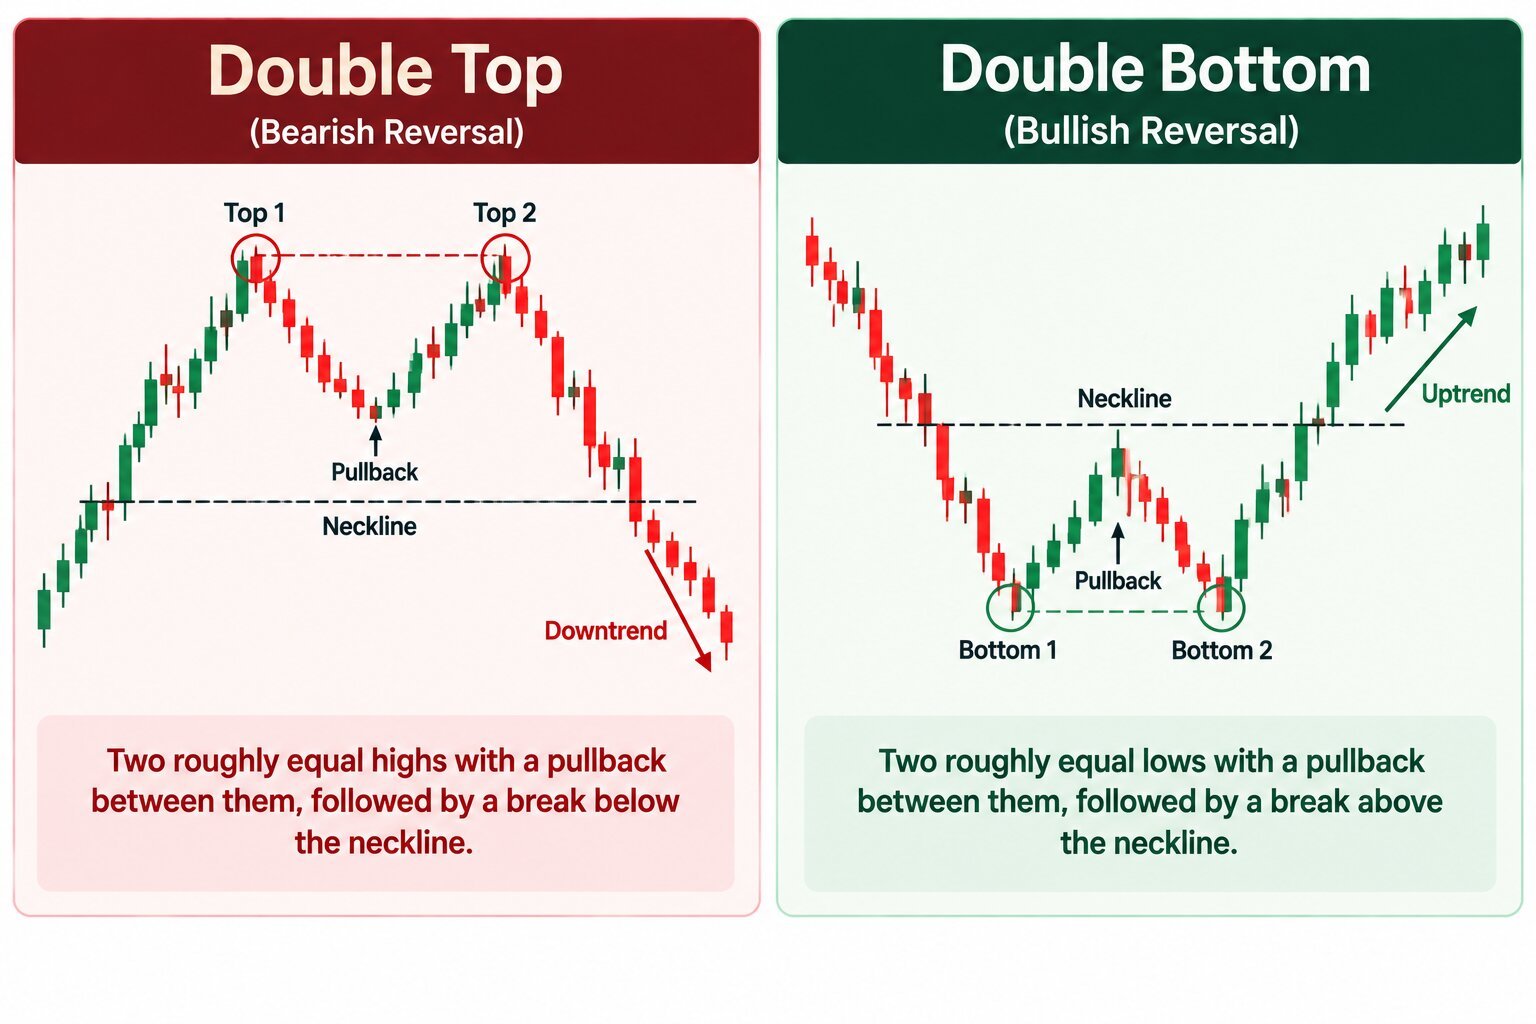
A double top forms when price hits a resistance level, pulls back, then rallies to roughly the same level again and fails — two attempts, two failures, often signalling a reversal lower. A double bottom is the mirror image at support.
The pattern isn't confirmed until price actually breaks through the level in between the two peaks or troughs.
3. Triangles
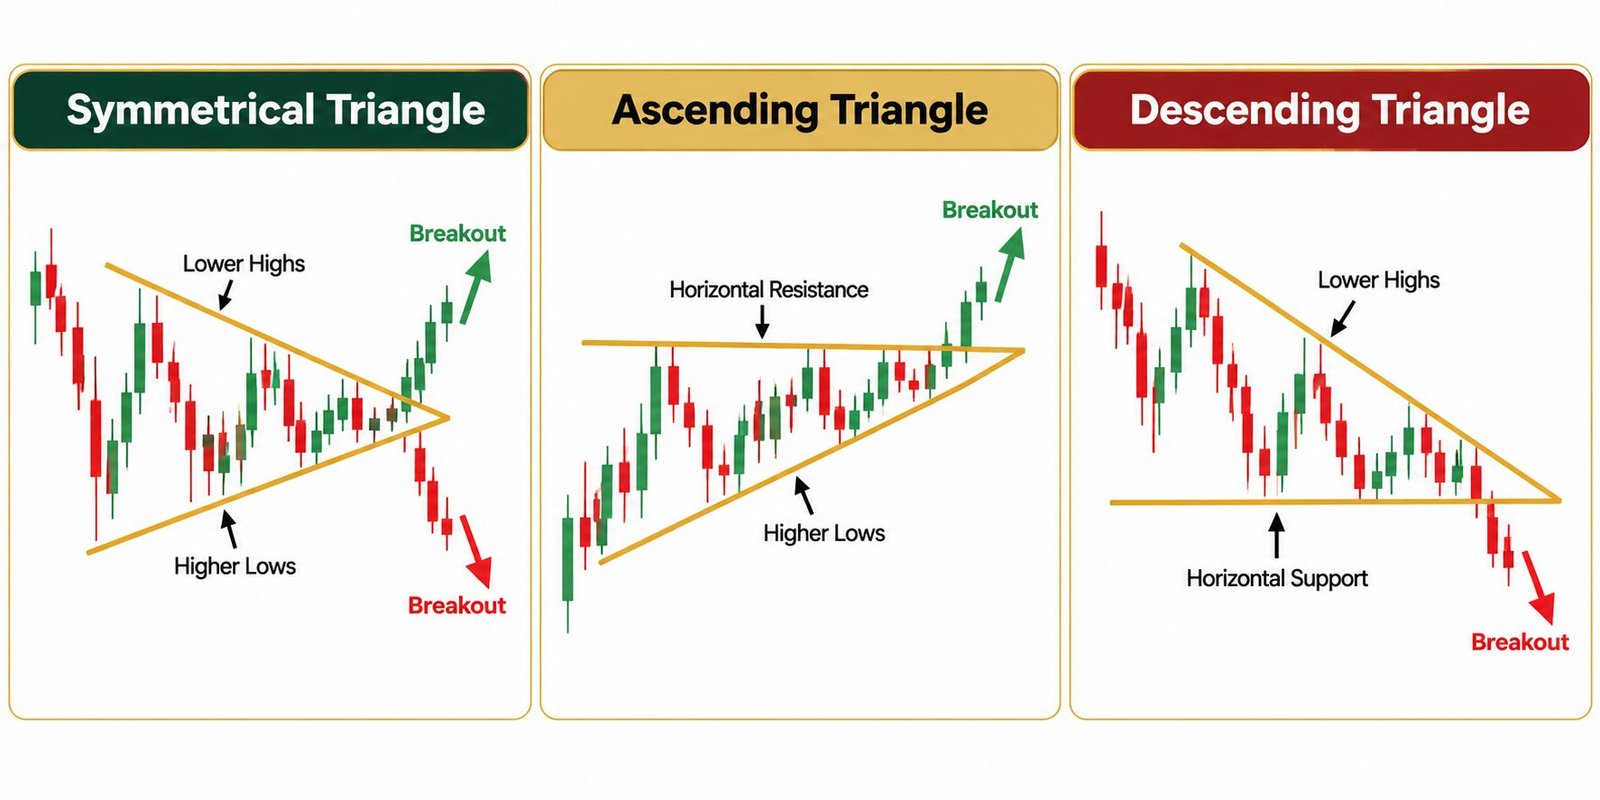
Triangles form when price consolidates between converging trendlines — a symmetrical triangle has both lines converging, an ascending triangle has a flat top with rising lows, and a descending triangle has a flat bottom with falling highs.
Triangles represent a temporary pause before the next move — the eventual breakout direction (up or down) is what matters, not the pause itself.
4. Flags & Pennants
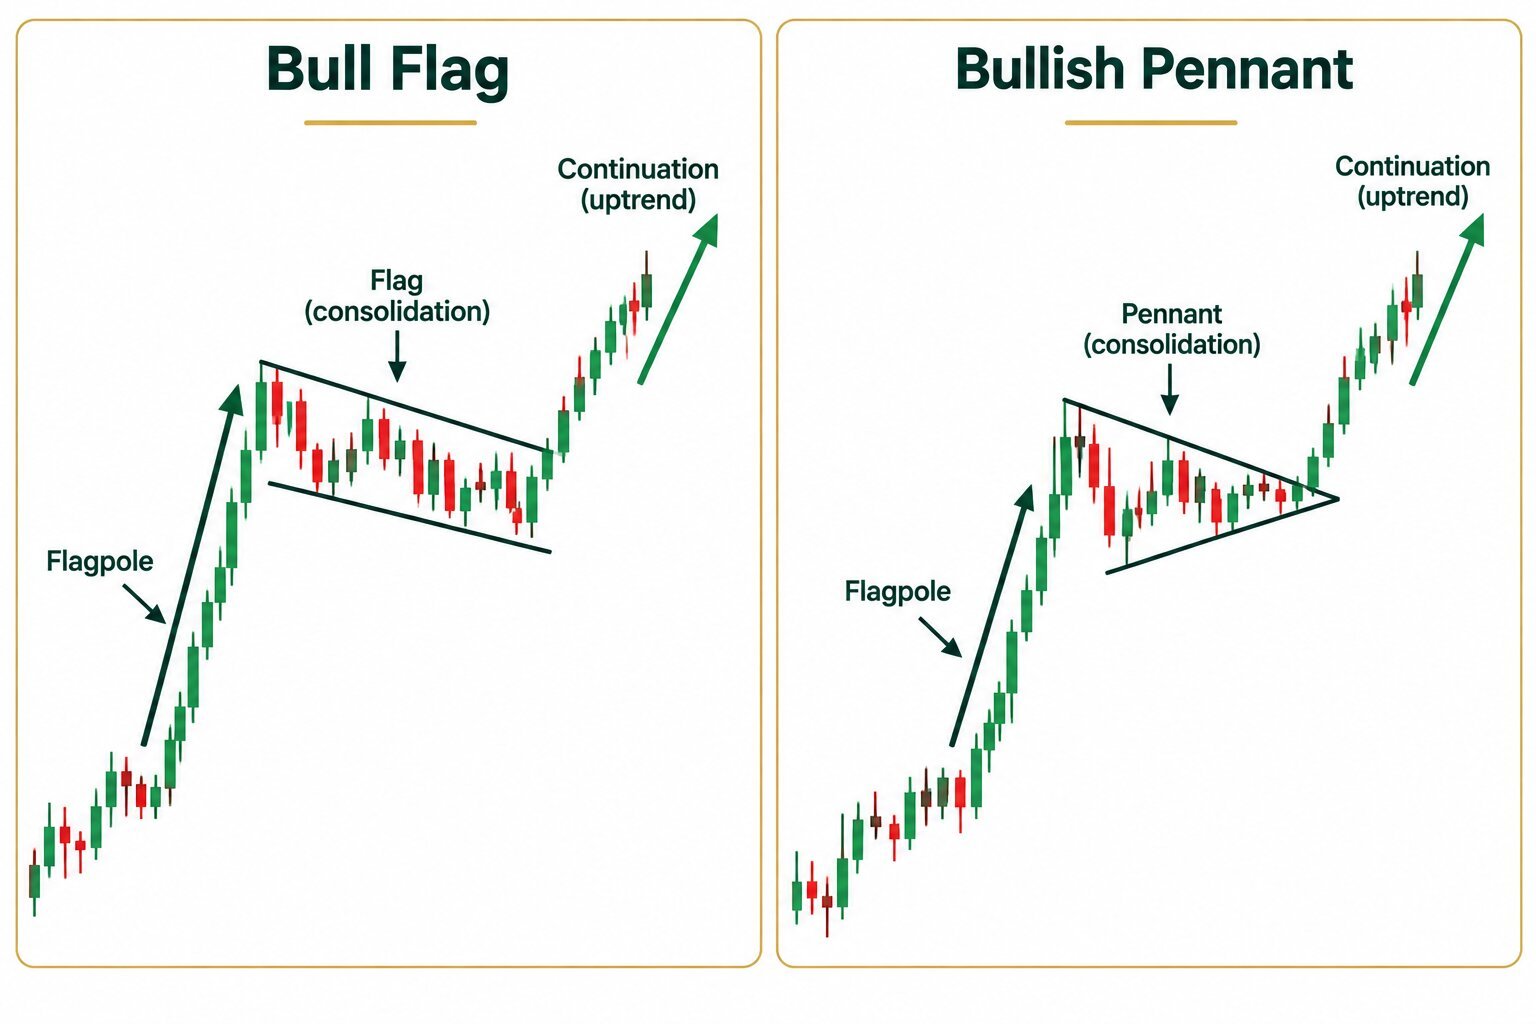
After a sharp price move, a flag (a small rectangular pullback) or pennant (a small triangular pullback) often forms as the market briefly catches its breath before continuing in the original direction.
These are considered 'continuation' patterns — the expectation is that the prior trend resumes once the brief pause ends, not that it reverses.
5. Breakouts
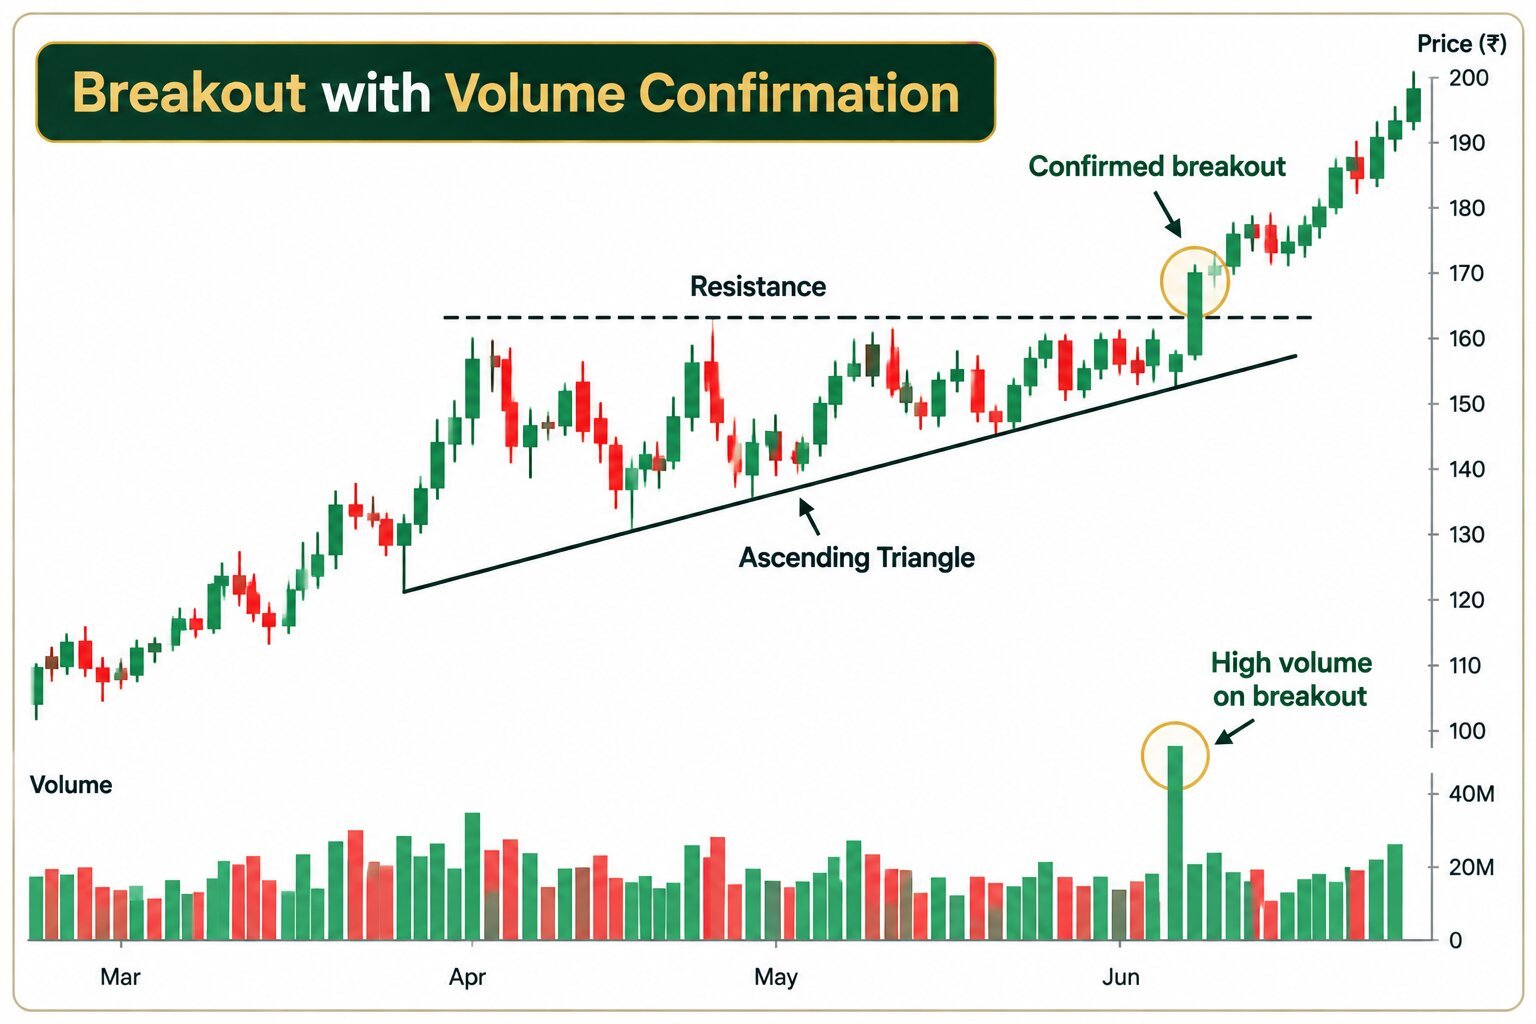
A breakout is when price moves decisively beyond a defined support, resistance, or pattern boundary — the moment a pattern actually 'resolves' into its next move.
A breakout on strong volume is far more trustworthy than one on weak volume — this is exactly why Module 1's volume lesson matters everywhere else in this course.