Introduction
Indicators translate raw price and volume data into a simpler visual signal. This module covers the handful of indicators genuinely worth learning first, and how they complement — never replace — the price chart itself.
1. Moving Averages
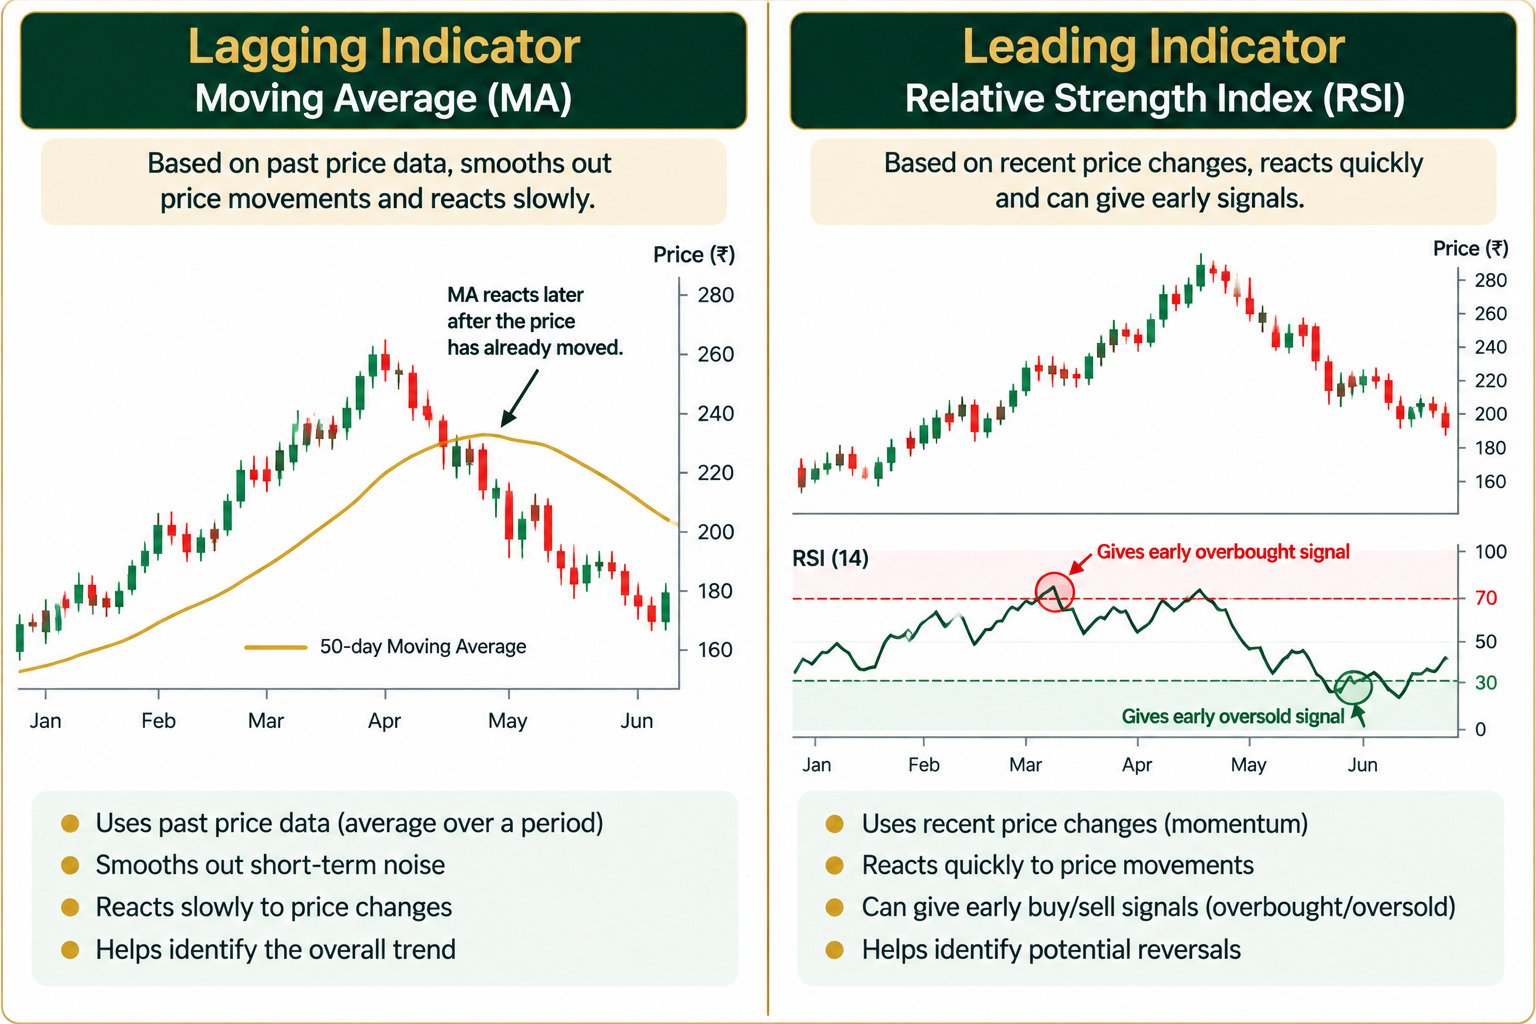
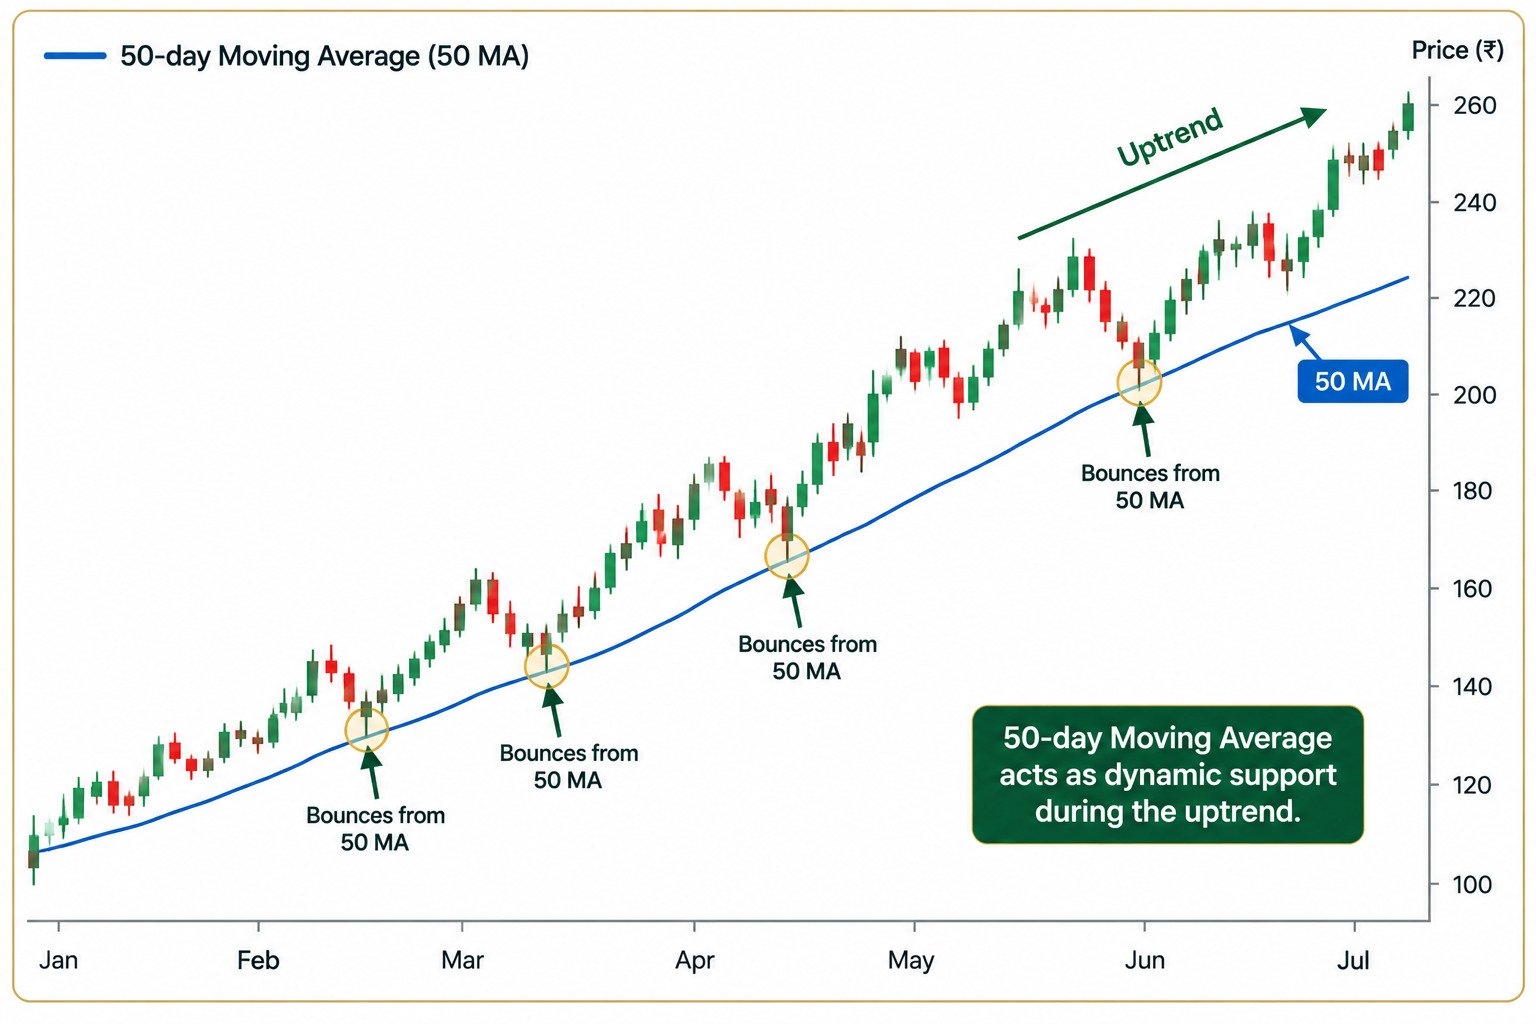
A moving average smooths out day-to-day noise by averaging price over a set number of periods (e.g., the last 50 or 200 days), making the underlying trend easier to see.
When price is above a rising moving average, it's generally a sign of an uptrend; when below a falling one, a downtrend. The average itself often acts as dynamic support or resistance.
2. RSI (Relative Strength Index)
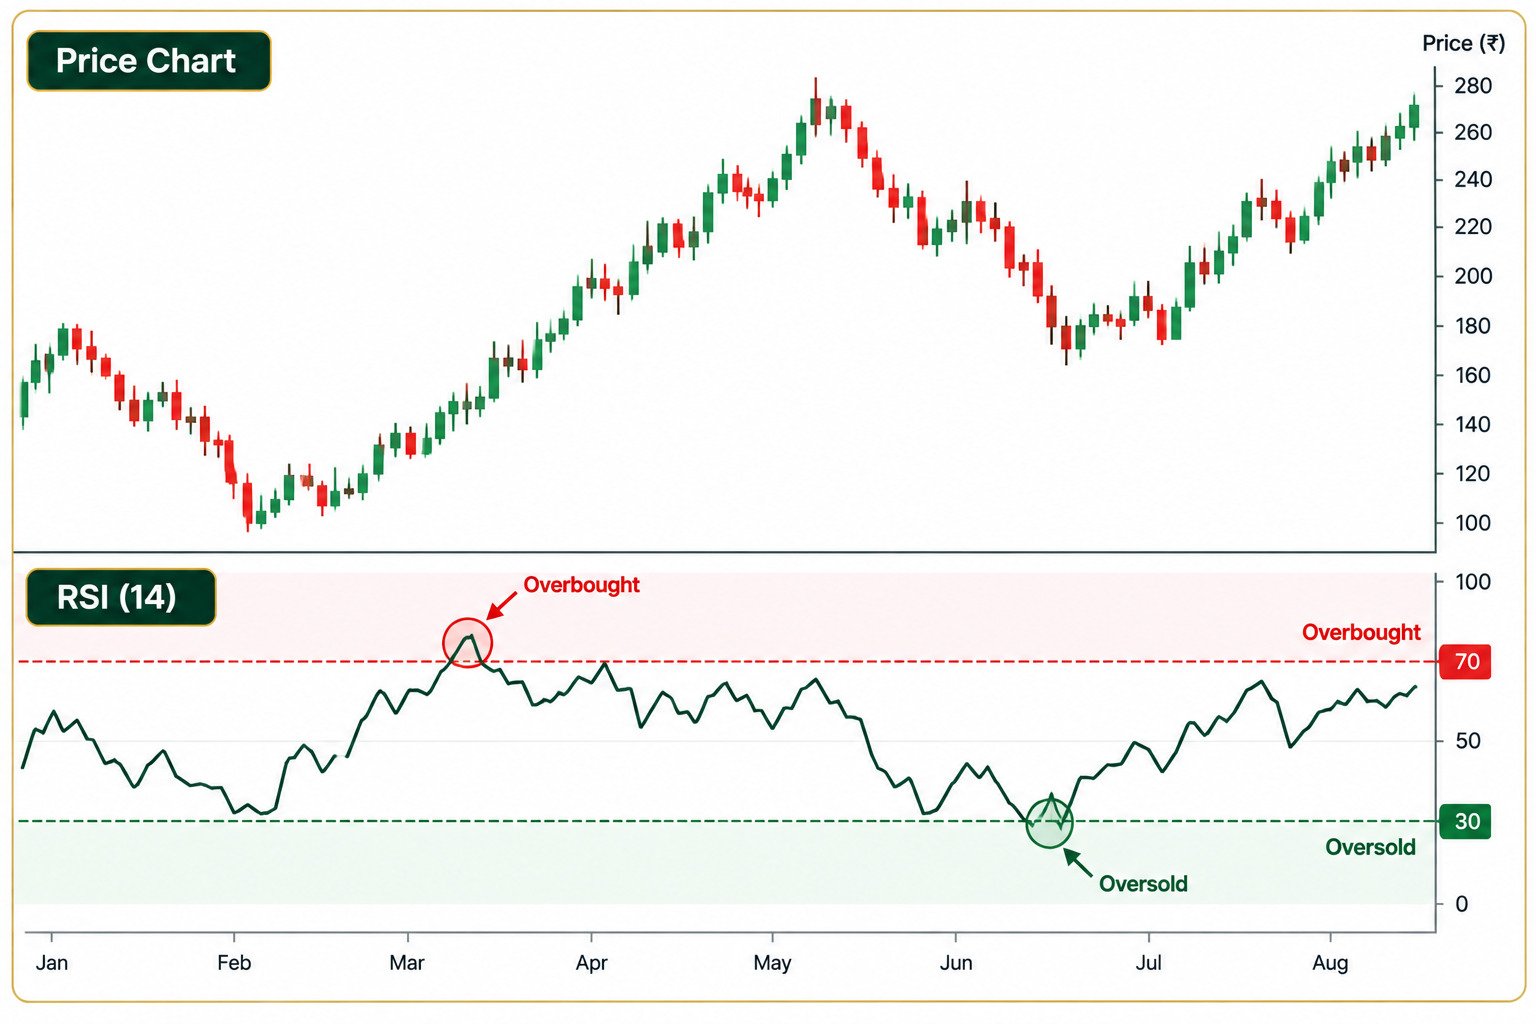
RSI measures the speed and size of recent price moves on a scale of 0 to 100, helping identify when a stock may be 'overbought' (often above 70) or 'oversold' (often below 30).
RSI works best alongside trend and price action — an overbought reading in a strong uptrend can stay overbought for a long time, so it's a signal to watch, not an automatic sell trigger.
3. MACD
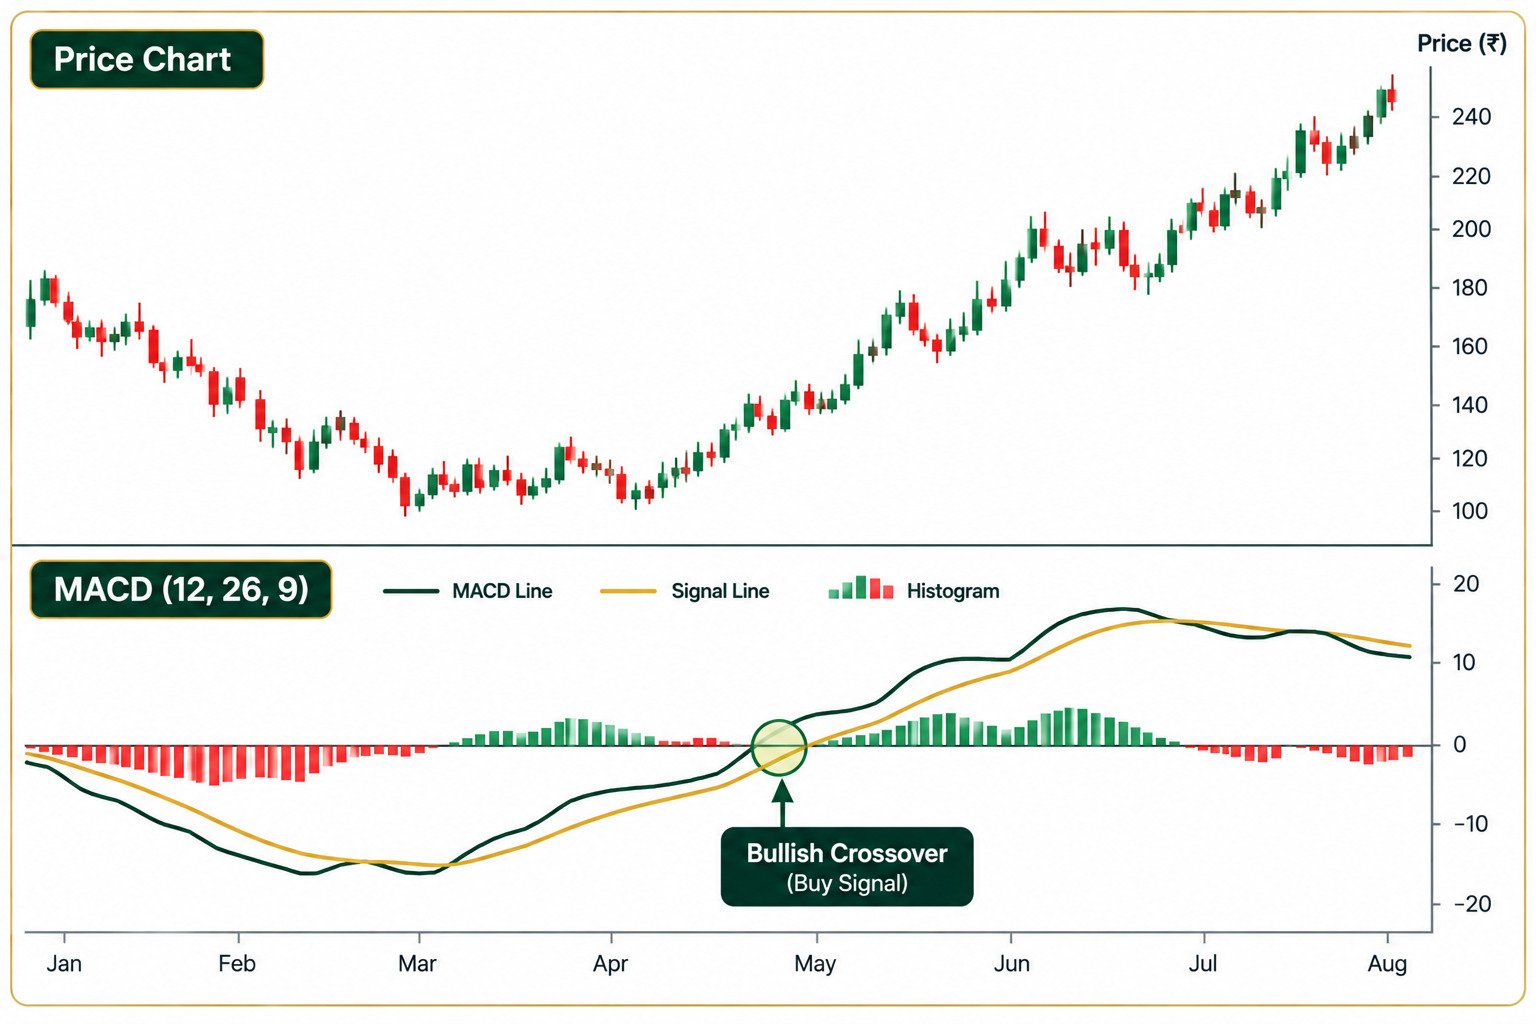
MACD (Moving Average Convergence Divergence) tracks the relationship between two moving averages to help spot changes in momentum, direction, and trend strength.
When the MACD line crosses above its signal line, it's often read as bullish momentum building; a cross below is read as bearish. Like all indicators, it's more reliable when it agrees with the overall trend rather than fighting it.
4. Bollinger Bands
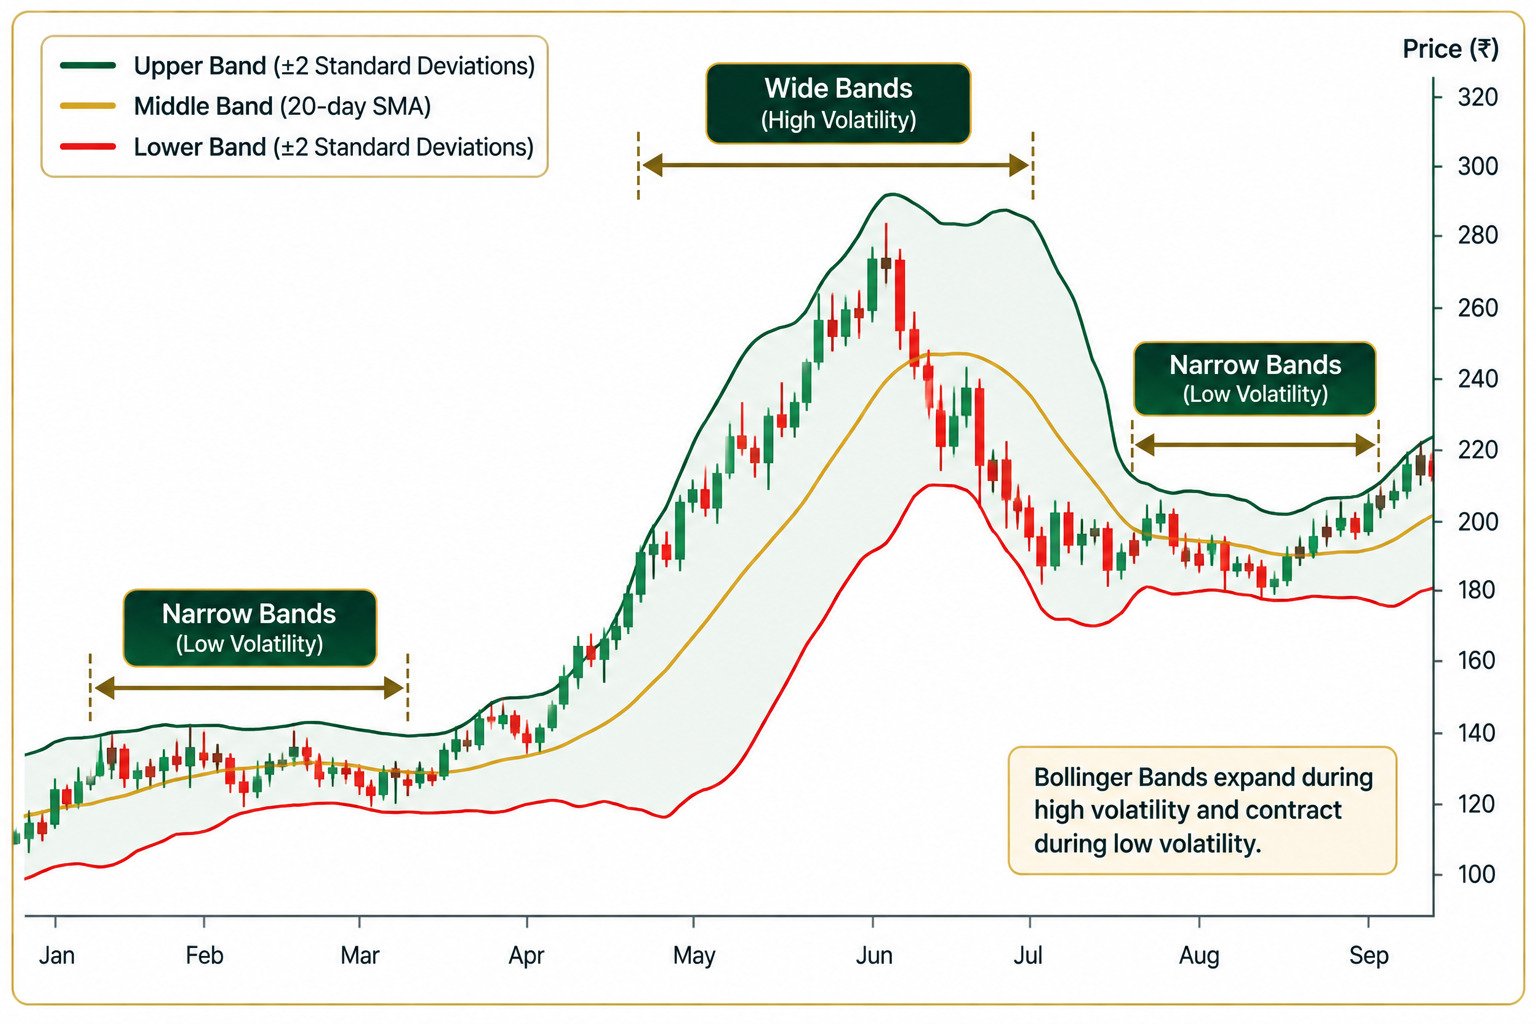
Bollinger Bands plot a moving average with two bands above and below it, based on how much price is fluctuating (volatility). Bands widen when volatility rises and narrow when it falls.
Price touching the upper band isn't automatically 'too expensive,' and touching the lower band isn't automatically 'cheap' — in a strong trend, price can ride along a band for an extended stretch.
5. Leading vs Lagging Indicators
Lagging indicators (like moving averages) confirm what has already happened — reliable, but slower to react. Leading indicators (like RSI) attempt to signal what may happen next — faster, but with more false signals.
Most experienced traders use a combination of both rather than relying on either type alone.