Introduction
Support and resistance are the two most fundamental concepts in all of technical analysis — nearly every other tool you'll learn in this course, from trendlines to chart patterns, ultimately connects back to these two ideas.
1. What Are Support and Resistance?
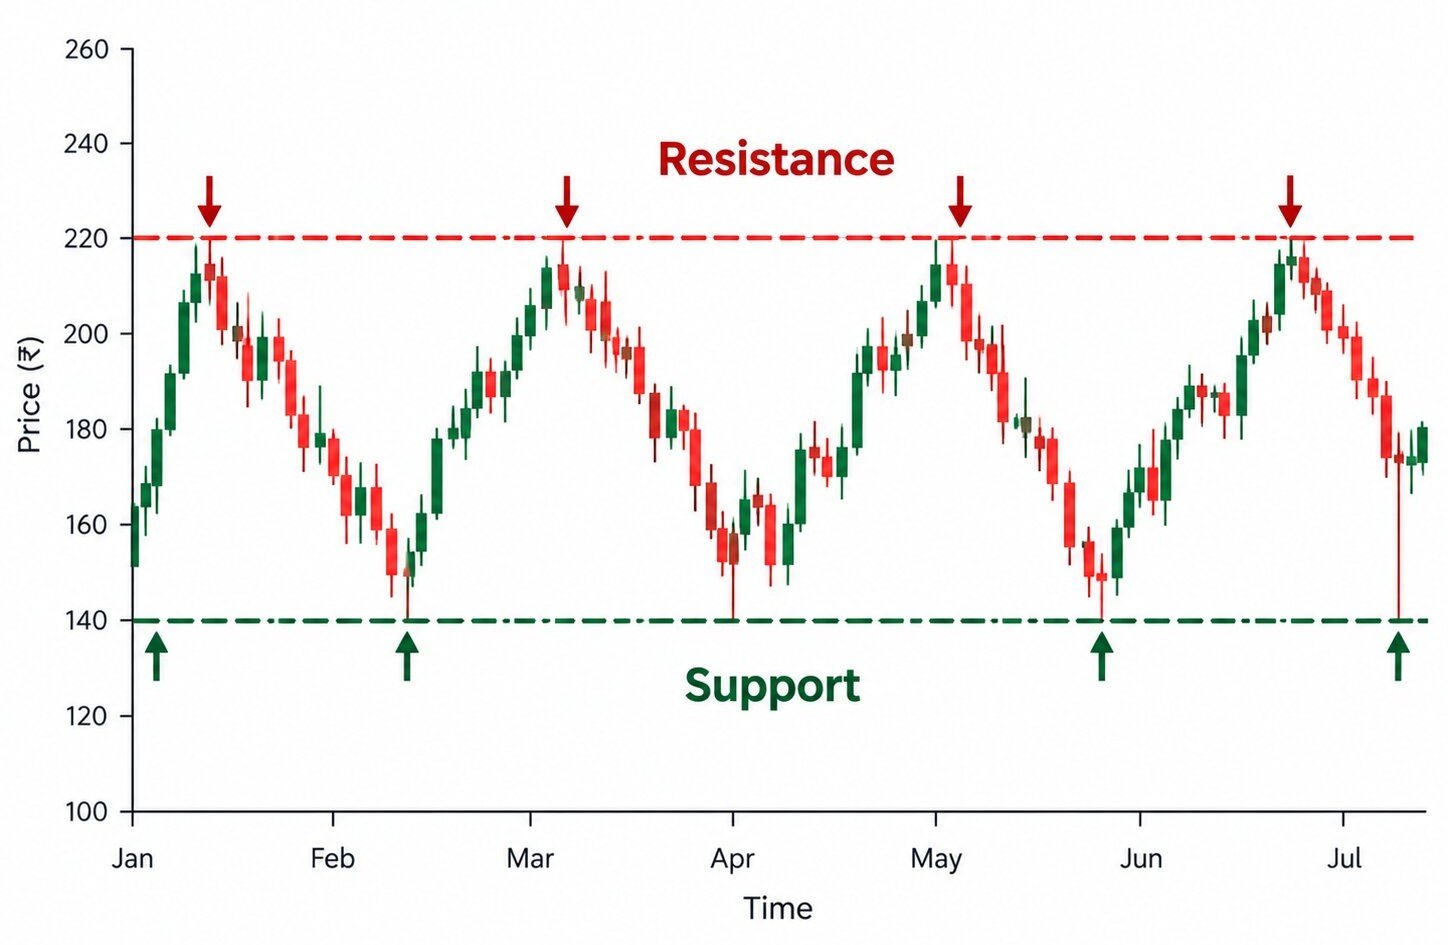
Support is a price level where a stock has repeatedly stopped falling and bounced back up — think of it as a floor. Resistance is the opposite: a ceiling where price has repeatedly struggled to break higher.
Almost every other tool in technical analysis — trendlines, chart patterns, indicators — ultimately connects back to these two ideas in some way.
2. How Support & Resistance Levels Form
These levels form because traders remember them — people who bought near a level often defend it by buying again, and people who missed selling near a level often sell there next time price returns. It's crowd psychology showing up on a chart.
Round numbers, previous major highs/lows, and heavily-traded price zones tend to become the strongest levels, simply because more people remember them.
3. Drawing Support & Resistance Correctly
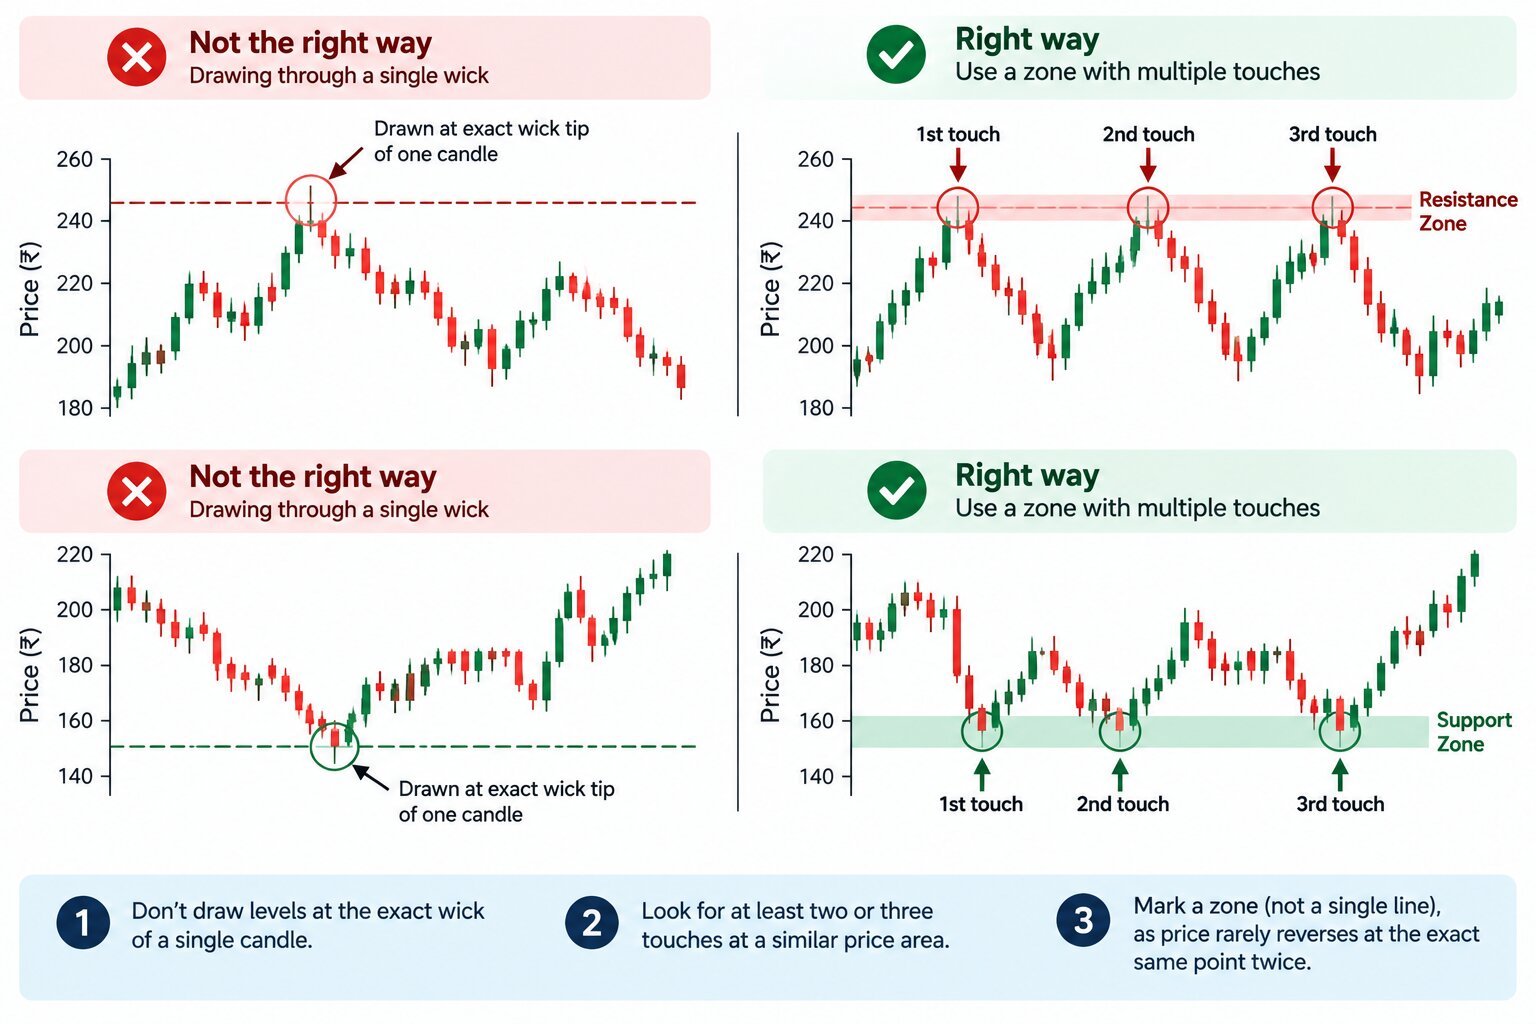
A common beginner mistake is drawing a level through the exact wick tip of a single candle — real levels are usually a zone, not a single precise price, since price rarely reverses at exactly the same point twice.
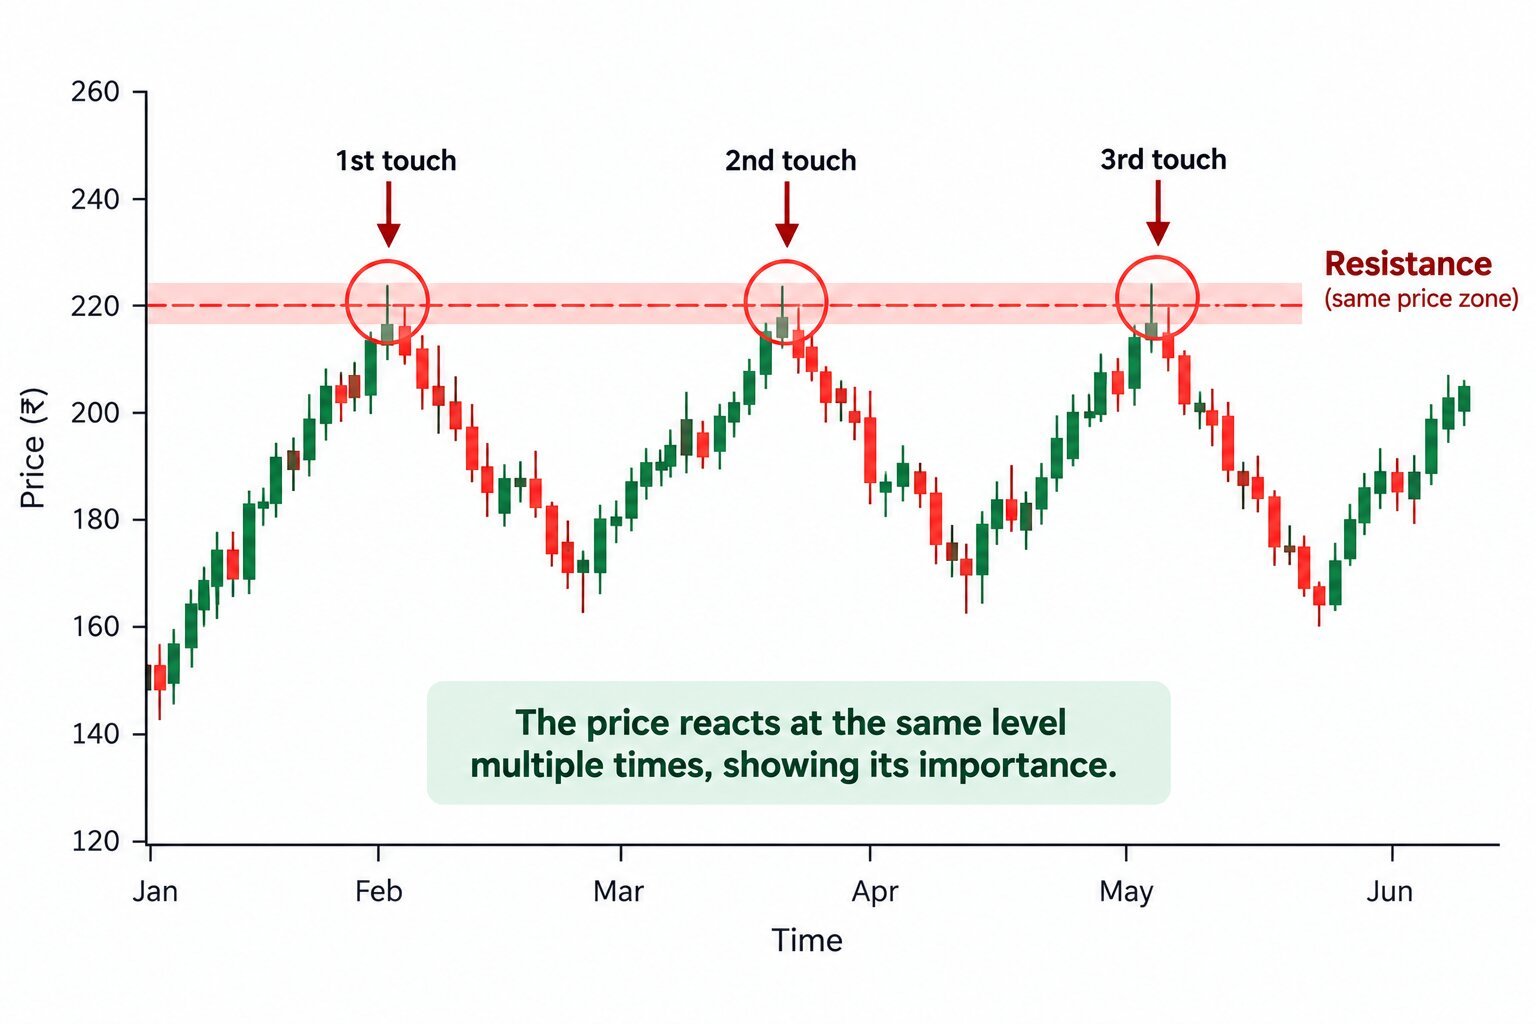
Look for at least two or three separate touches at a similar price area before treating it as a meaningful level, not just one isolated bounce.
4. Role Reversal — When Support Becomes Resistance
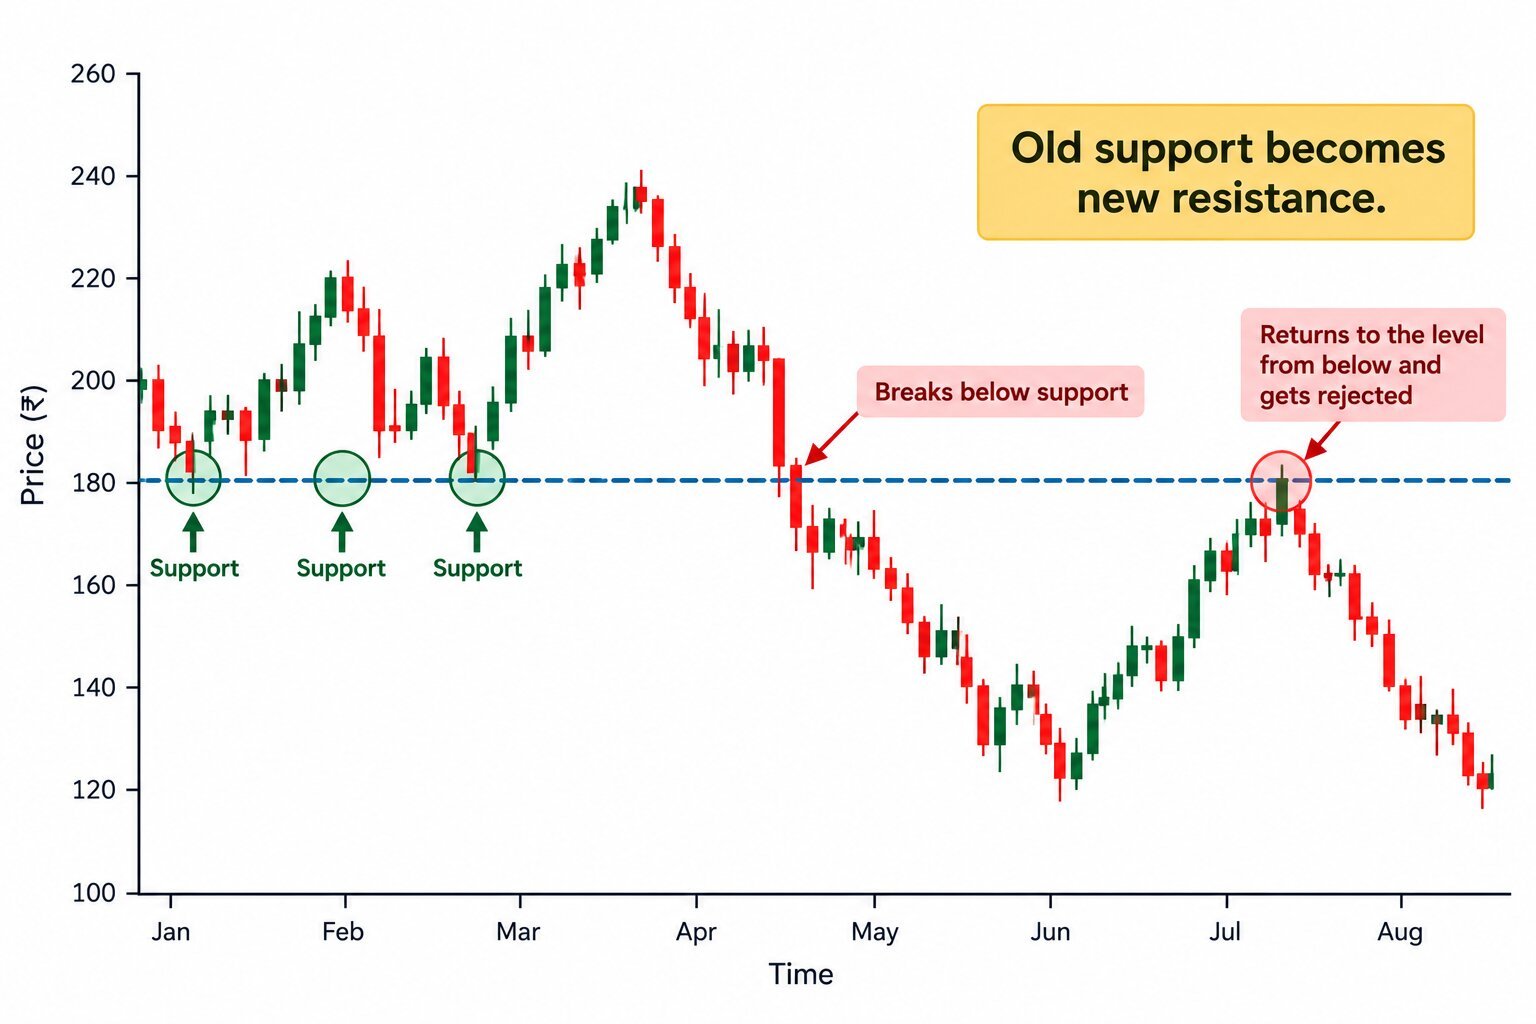
Once a support level is broken decisively, it often 'flips' and starts acting as resistance on the way back up — and the same happens in reverse when resistance breaks.
This happens because traders who bought at the old support and are now underwater often sell to 'get out even' when price returns to that level, creating fresh selling pressure exactly there.
5. Using S &R With Volume for Confirmation
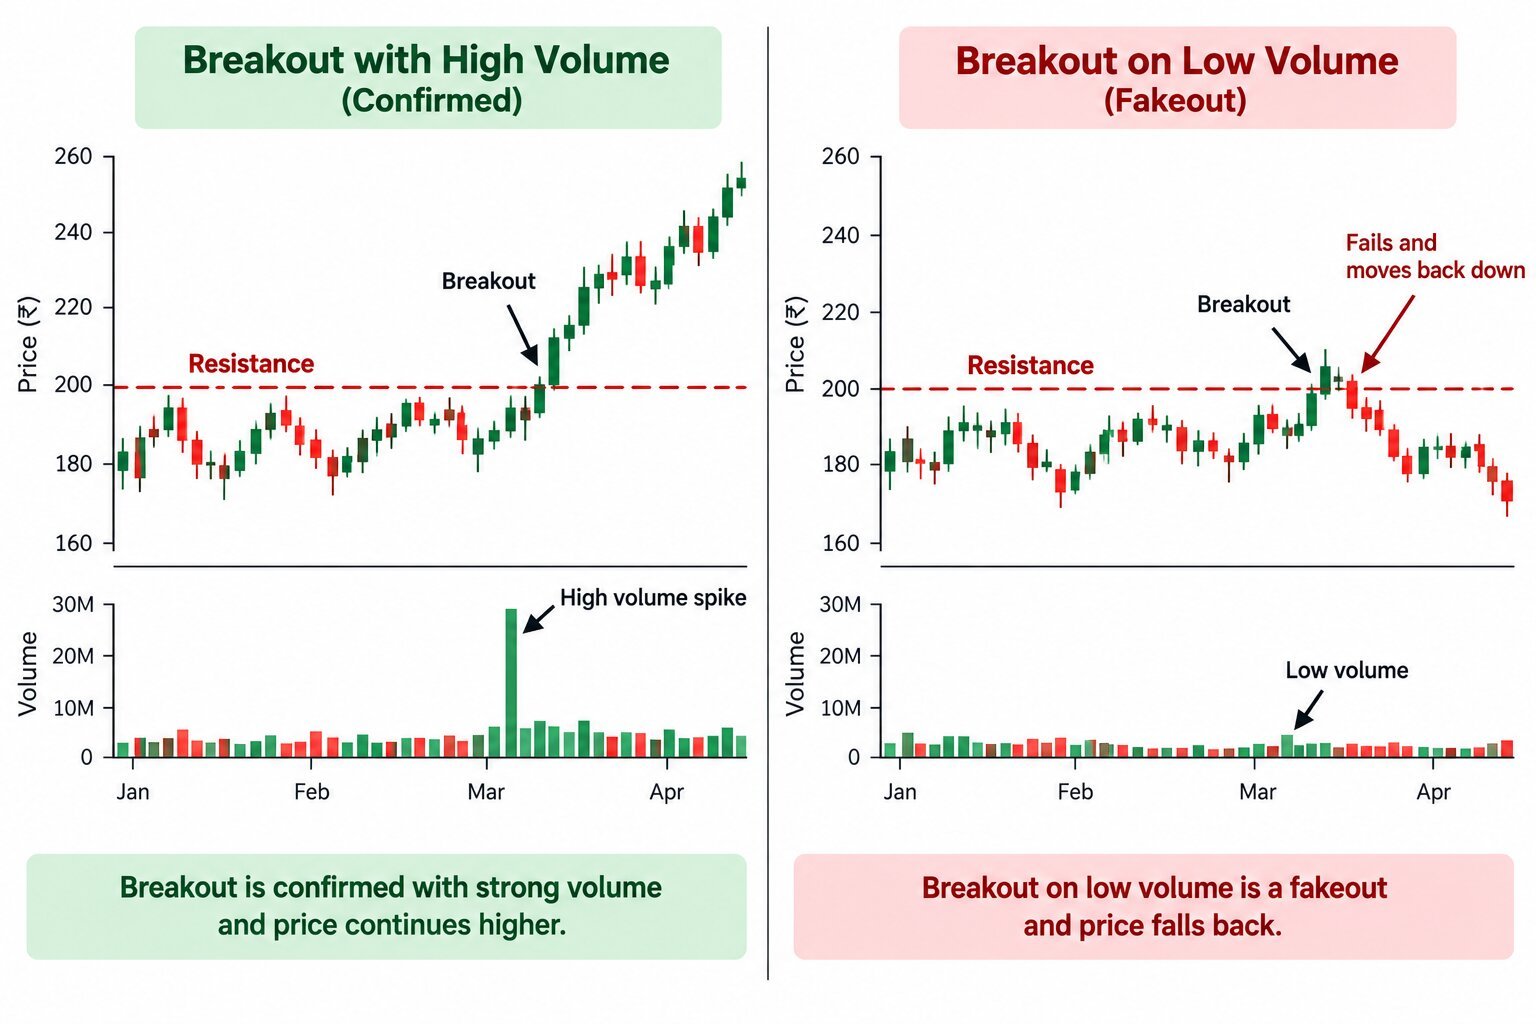
A bounce off support or a break of resistance carries far more weight when it happens on above-average volume — it shows real conviction behind the move, not just a brief wobble.
A break on very low volume is more likely to be a 'fakeout' — a brief poke through the level that quickly reverses back.